title: How to Use JMeter for Performance Testing author: Your Author Name date: 2021-11-04 09:43:04.000000000 Z categories:
- Blogging
- Demo tags:
- typography pin: true math: true mermaid: true image: path: “/commons/devices-mockup.png” lqip: data:image/webp;base64,UklGRpoAAABXRUJQVlA4WAoAAAAQAAAADwAABwAAQUxQSDIAAAARL0AmbZurmr57yyIiqE8oiG0bejIYEQTgqiDA9vqnsUSI6H+oAERp2HZ65qP/VIAWAFZQOCBCAAAA8AEAnQEqEAAIAAVAfCWkAALp8sF8rgRgAP7o9FDvMCkMde9PK7euH5M1m6VWoDXf2FkP3BqV0ZYbO6NA/VFIAAAA alt: Responsive rendering of Chirpy theme on multiple devices.

JMeter is a popular opensource tool for performance testing applications. Objective of the article is to provide a step-by-step guide to configuring JMeter for performance testing. In the first few sections we will briefly look at what is performance testing, why we need performance testing, performance testing types and different performance testing tools available in the market and then we will look at how we can use JMeter to perform performance testing.
What is Performance Testing ?
Performance testing is a measurement of the stability and response time of an application by applying a load.
- Stability : Ability to withstand design number of users
- Response time : Time taken to send the request to the server and run that program and taking back the response from server
- Load : Number of app users over a specified period of time
Why do Performance Testing ?
Performance testing is carried out to provide information to stakeholders about their application’s performance, stability, and scalability. Performance Testing, moreover, reveals what has to be addressed before a product is released to the market. Without performance testing, software is more likely to have issues like slowness when multiple people are using it at the same time, inconsistencies across different operating systems, and poor usability.
Every developer should run performance tests on his or her application to learn more about its capabilities. The number of transactions / requests per second that your application can handle will be determined by performance testing. Performance tests will also tell you how much memory / CPU time is required when they are loaded, what the application’s limits are, and what points or scenarios the application will break under load.
Types of Performance Testings
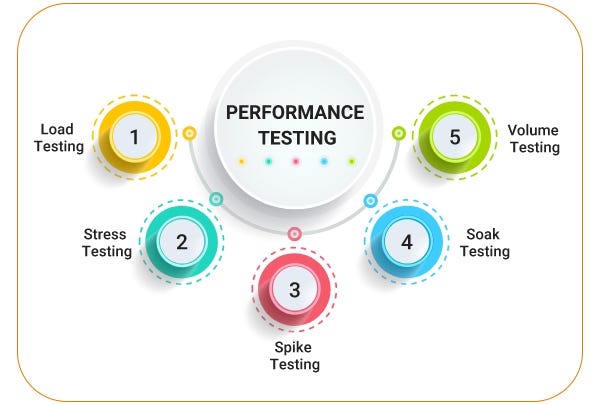
Although the image above depicts five different types of performance tests, we’ll focus on the two most common.
Load Testing
In load testing, we are testing the stability and response time of an application by applying load which is equal and less than the design number of users.

Stress Testing
In stress testing, we are testing the stability and response time of an application by applying a load more than the design number of users.

Technology Landscape
There are numerous performance testing tools available on the market. The tool you use for testing will be determined by a variety of factors, including the type of protocol supported, license cost, hardware requirements, platform support, and so on. The following is a list of commonly used testing tools.
- LoadNinja
- Apache JMeter
- WebLOAD
- LoadUI Pro
- LoadView
- NeoLoad
- LoadRunner
- Silk Performer
- AppLoader
- SmartMeter.io
JMeter

JMeter is an open source desktop Java application designed to measure performance of an application. It can be used to analyze and evaluate the performance of web applications and other services.
Installation
Install Apache JMeter on Ubuntu
1.Install Java (If you have not already installed).
2. Download the latest stable version of Apache JMeter.
wget http://www.gtlib.gatech.edu/pub/apache/jmeter/binaries/apache-jmeter-5.4.1.tgz
3. Extract the downloaded JMeter file.
tar xf apache-jmeter-5.4.1.tgz
4. Navigate to the bin directory.
cd apache-jmeter-5.4.1/bin
5. Run the jmeter.sh script to install JMeter.
./jmeter.sh
Create a Test Plan in JMeter and Generate a Dashboard Report
Here, I am going to do a load testing on our sample application (Delivery ETA Progress Screen API) using 150 users.
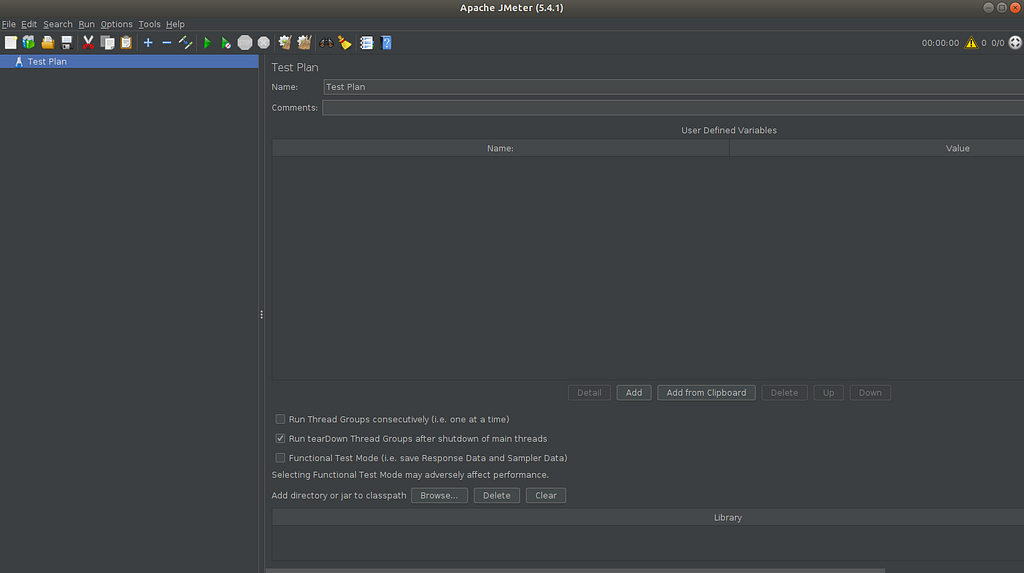
Step 1: Launch the JMeter application.
The following screen will appear after launching JMeter.
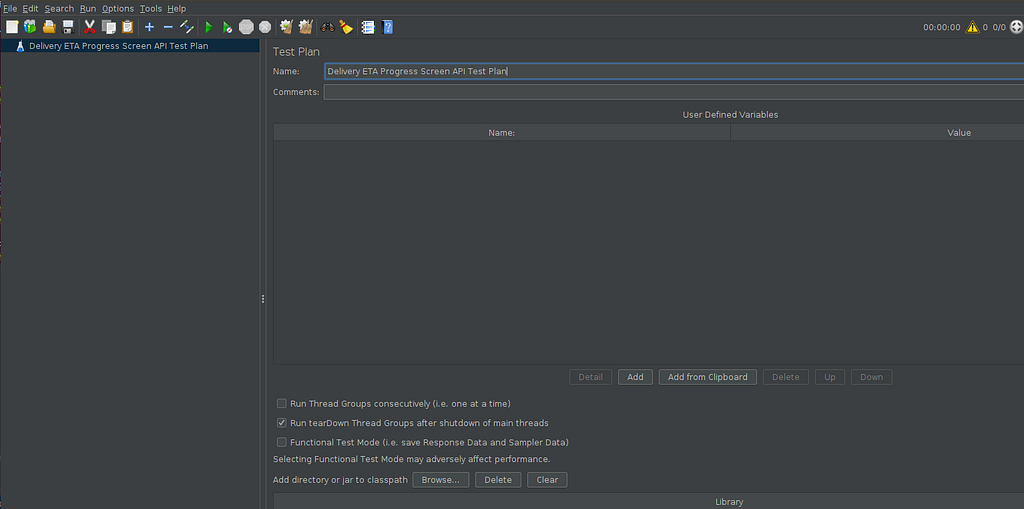
Step 2: Provide a name for your test plan and save it.
Then you will see the following screen.
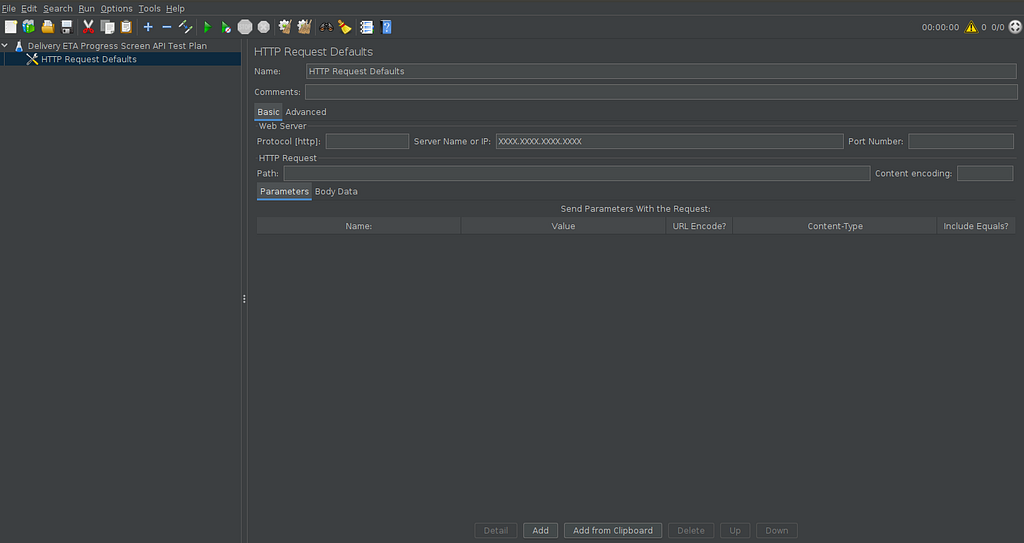
Step 3: Add an HTTP Request Defaults .
This element is used to set default values for HTTP request in our test plan.
- Select Test Plan (Delivery ETA Progress Screen API Test Plan), then Right-click it
- Go to Add > Config Element > HTTP Request Defaults
- In HTTP Request Defaults, under the Web Server section, fill in the Server Name or IP field with the name or IP address of the web server you want to test. Setting the server here makes it the default server for the rest of the items in this Test Plan.
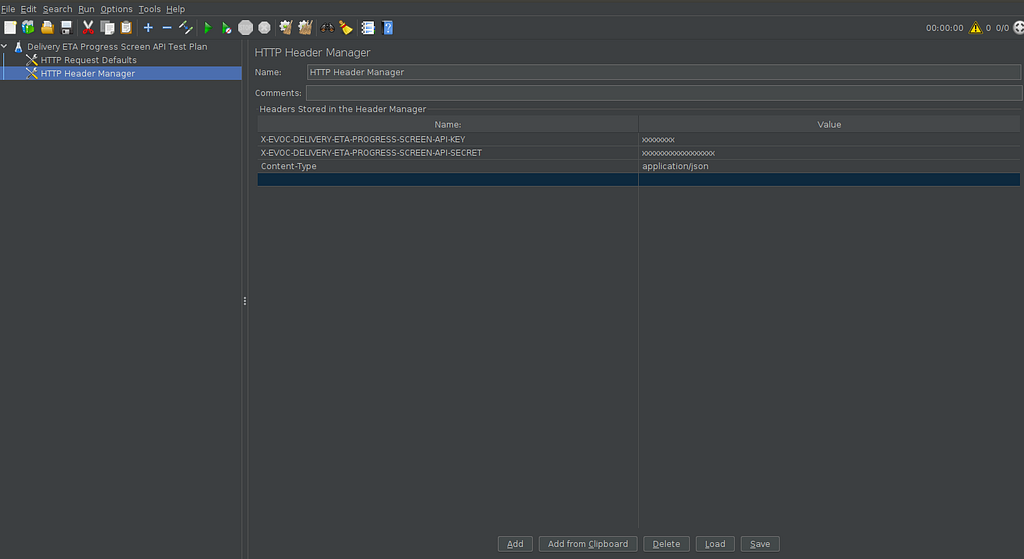
Step 4: Add an HTTP Header Manager.
This element is used to set default header values for HTTP request in our test plan.
- Select Test Plan (Delivery ETA Progress Screen API Test Plan), then Right-click it
- Go to Add > Config Element > HTTP Header Manager
- In HTTP Header Manager, You can add a header name and value using the add button at the bottom of the window. Setting the headers here makes it the default headers for the all requests in this Test Plan.
Step 5: Add a Thread group.
- Select Test Plan (Delivery ETA Progress Screen API Test Plan), then Right-click it
- Go to Add > Threads (Users) > Thread group
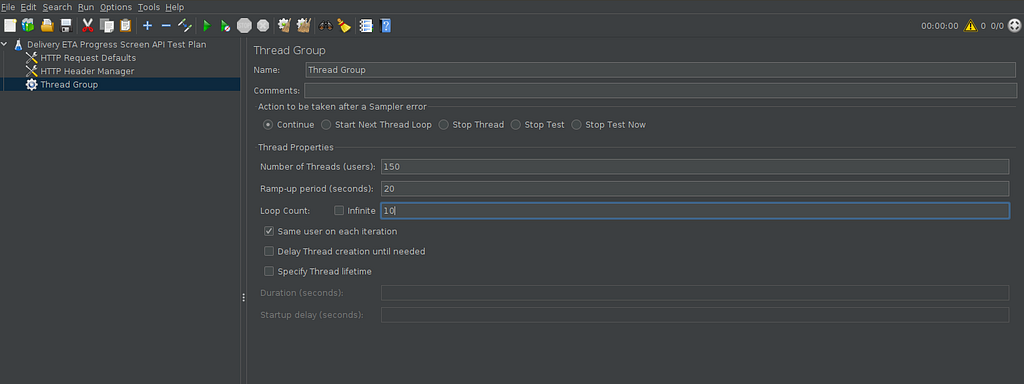
- The thread group has three particularly important properties and you need to set them for doing a load test.
✓ Number of Threads (users) : Total number of users that will connect to the service at once
✓ Ramp-up period (seconds) : How long does JMeter take to start the total number of threads
✓ Loop count — How many times the test would be executed
Step 6: Add an HTTP Request.
- Select Thread group , then Right-click it
- Go to Add > Sampler > HTTP Request
- Provide a name for your sample request and save it. In HTTP Request, under the HTTP Request section, fill in the Path that you want each thread (user) to request (No need to specify the server as it is already defined in the HTTP Request Defaults). Select POST or Get from the drop down according to the your sample request. If it is a POST request , add post body into Body Data.
Note: Body data and parameters could not be entered at once, As a way to do that, I used the url path with the parameters of my HTTP request.
If you want to add more HTTP requests as part of your test, repeat these steps. Each thread will execute all the requests in this test plan.

Step 6: Add a Listener.
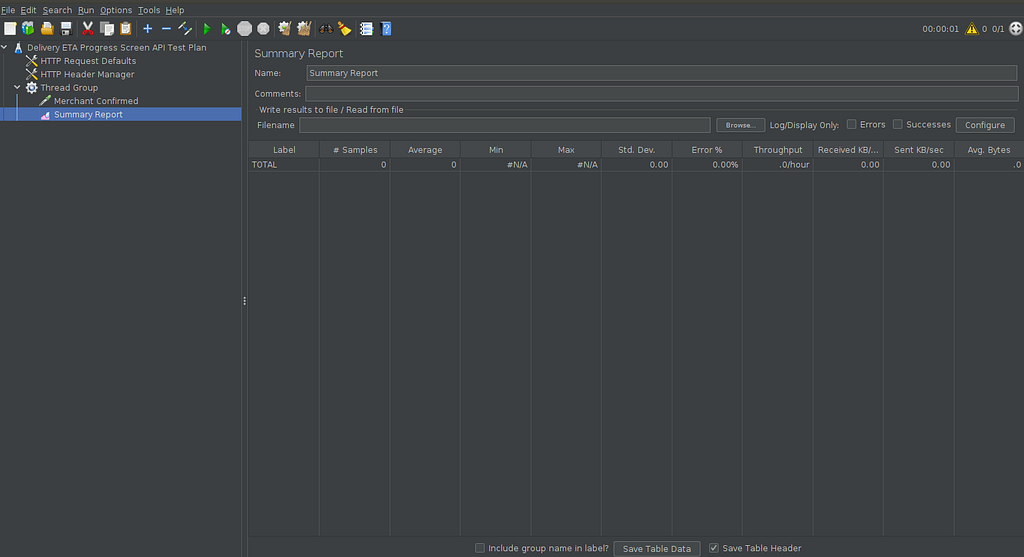
This element is used to get the results of load test. There are different types of listeners and you can add any type of listener you want. Here, I have used the Summary Report as a listener.
- Select Thread group , then Right-click it
- Go to Add > Listener > Summary Report
- If you want to write the results to csv, you can provide a path to the Filename.
Step 7: Run the Test Plan.
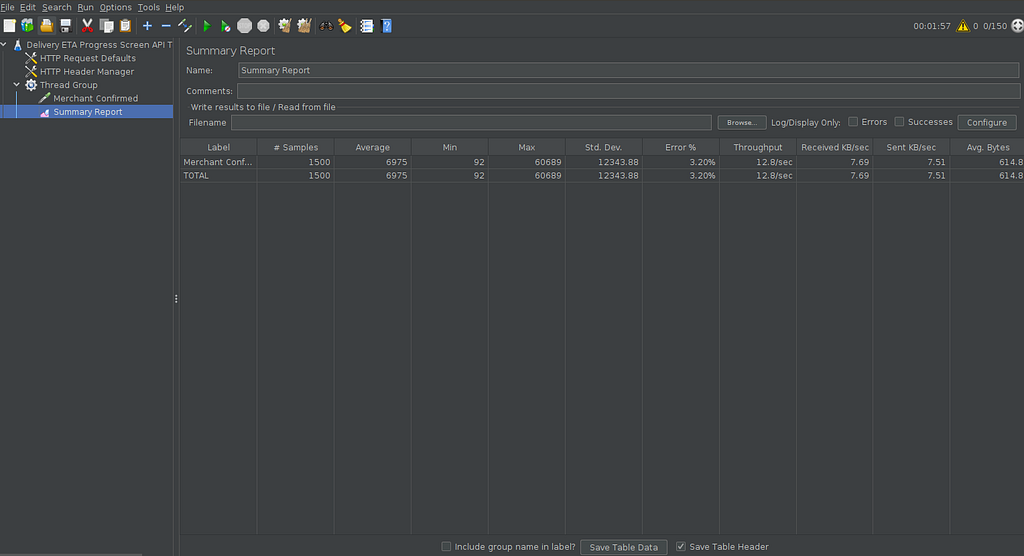
- Run the test plan using Green Start Arrow below the main menu. Then you will be able to see the test results in the Summary Report section as follows.
Step 8: Generate a Dashboard Report.
- Add ‘Simple Data Writer’ from the listeners as in step 6 and set the location to save the test results as follows.

2. Run your Test Plan.
3. Go to Tools (In main Menu) > Generate HTML report
Then following screen will appear.

- Result file (csv or jtl) : The file path where the result is saved.
- user.properties file: This file can be found in the JMeter bin directory.
- Output directory: The output directory where you want to save the report.
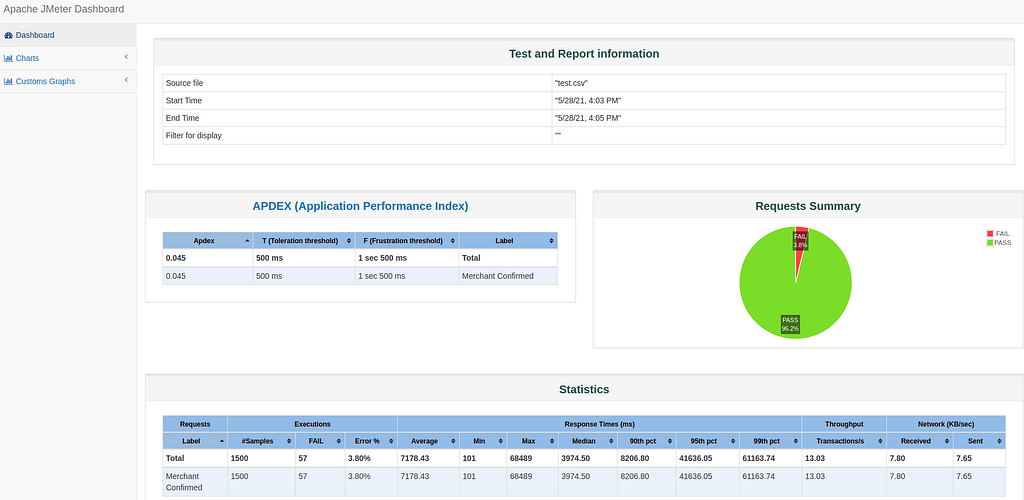
4. Configure the above file paths and click the Generation Report button at the bottom of the window. Then you will get a report as follows.
JMeter in Non-GUI Mode
The GUI mode of JMeter is perfect for adding and editing new configuration elements, thread groups and samplers as described above. However when increasing the load, running in the GUI mode would result in resource constraints in the instance running JMeter. This can adversely affect the results recorded by the listeners. To overcome this problem, JMeter can be executed in the non-GUI mode in an instance with better resource specification.
Run your test plan in non GUI Mode and Generate a report
Step 1: Install the JMeter on the machine where you want JMeter to be installed (Please refer the installation steps mentioned above )
Step 2: Create a test plan using the JMeter GUI mode that runs on your local machine and save it. Then you will get JMX file that contains the your test plan.
Step 3: Copy the JMX file to the remote server where you installed JMeter using the ‘scp’ command.
Step 4: Go to the server you installed JMeter and navigate into JMeter’s bin folder.
Step 5: Run the following command to run your test plan.
jmeter -n -t delivery_eta_progress_screen_test_plan.jmx -l log.jtl
-n : This specifies JMeter is to run in cli mode
-t : [name of JMX file that contains the Test Plan]
-l : [name of JTL file to log sample results to]
Step 6: After completing the test, copy the generated JTL file into your local machine using the ‘scp’ command.
Step 7: Generate a report using the JMeter GUI mode that runs on your local machine and generated JTL file. ( Please proceed from sub-step 3 of ‘Step 8: Generate a Dashboard Report’ mentioned above)
Conclusion
Performance testing is required in software engineering before marketing any software product because it is critical to customer satisfaction. If your application’s performance does not meet your customers’ expectations, they will move on to your competitor. So, it is more important to understand the challenges of performance testing as well as the process and tools available to create an effective performance test.
References
- https://jmeter.apache.org/usermanual/index.html
- https://celestialsys.com/blog/software-performance-testing-introduction-types/
- https://www.guru99.com/jmeter-performance-testing.html
- https://medium.com/edureka/performance-testing-life-cycle-d4242d39a5aa
<hr><p>How to Use JMeter for Performance Testing was originally published in The PickMe Engineering Blog on Medium, where people are continuing the conversation by highlighting and responding to this story.</p>